The Leveraged Trader | Real-Time Market Intelligence
SPYQQQDIAVIXGOLDSILVERWTI CRUDEBRENT CRUDEBITCOIN10Y TREASURY2Y TREASURYDXY USD INDEXEUR/USDUSD/JPYMOVE INDEXTLT BONDSHYG HIGH YIELDCOPPERNATURAL GASFED FUNDS RATEVIX TERM STRUCTURERUSSELL 2000S&P 500 SECTORSBALTIC DRY INDEXSKEW INDEXSPYQQQDIAVIXGOLDSILVERWTI CRUDEBRENT CRUDEBITCOIN10Y TREASURY2Y TREASURYDXY USD INDEXEUR/USDUSD/JPYMOVE INDEXTLT BONDSHYG HIGH YIELDCOPPERNATURAL GASFED FUNDS RATEVIX TERM STRUCTURERUSSELL 2000S&P 500 SECTORSBALTIC DRY INDEXSKEW INDEX
🎯 FUTURES I WATCH STIFEL TRADE DESK LIVE TRADINGVIEW CHARTS • CLICK TO EXPAND
// LIVE CHARTS POWERED BY TRADINGVIEW
SPY S&P 500 ETF
QQQ Nasdaq ETF
DIA Dow Jones ETF
MARKETS LIVE
SPY
QQQ
VIX
GOLD
10Y
WTI
ET --:--:--
STIFEL TRADE DESK • LIVE MARKET OPERATIONS
CRISIS ALERT
🚨 RED ALERT US-ISRAEL WAR ON IRAN + STAGFLATION RISK CONVERGING
OIL ABOVE $100 FOR FIRST TIME SINCE 2022 STRAIT OF HORMUZ EFFECTIVELY CLOSED DOW FUTURES DOWN 1,000 PTS DEFENSIVE POSTURE ACTIVE
WAR DAY 10 • BRENT CRUDE ~$103 to $120 per BBL • GASOLINE $3.45+ NATIONWIDE • UPDATED: MAR 9, 2026
📊 DAILY MARKET MOVERS & PERFORMANCE LIVE • POWERED BY TRADINGVIEW
MARKET OVERVIEW & TOP MOVERS
CRYPTO & COMMODITY PERFORMANCE
FINAL WARNING • MARCH 16, 2026
CONNOR'S LETTER

📜 FINAL WARNING LETTER MARCH 16, 2026

📜
OFFICIAL
STATEMENT
⚠ FINAL WARNING FROM THE TRADE DESK
A MESSAGE TO MY DISTINGUISHED ACQUAINTANCES,
ROYAL DIGNITARIES & CLOSE FRIENDS
MARCH 16, 2026 • CONNOR STIFEL • THE LEVERAGED TRADER

To all who receive this correspondence,

This is a final warning of grave consequence regarding the economic welfare of this nation. I write not in speculation, but in the certainty borne of years at the trade desk, the study of markets, and the undeniable convergence of forces now aligned against the common citizen.

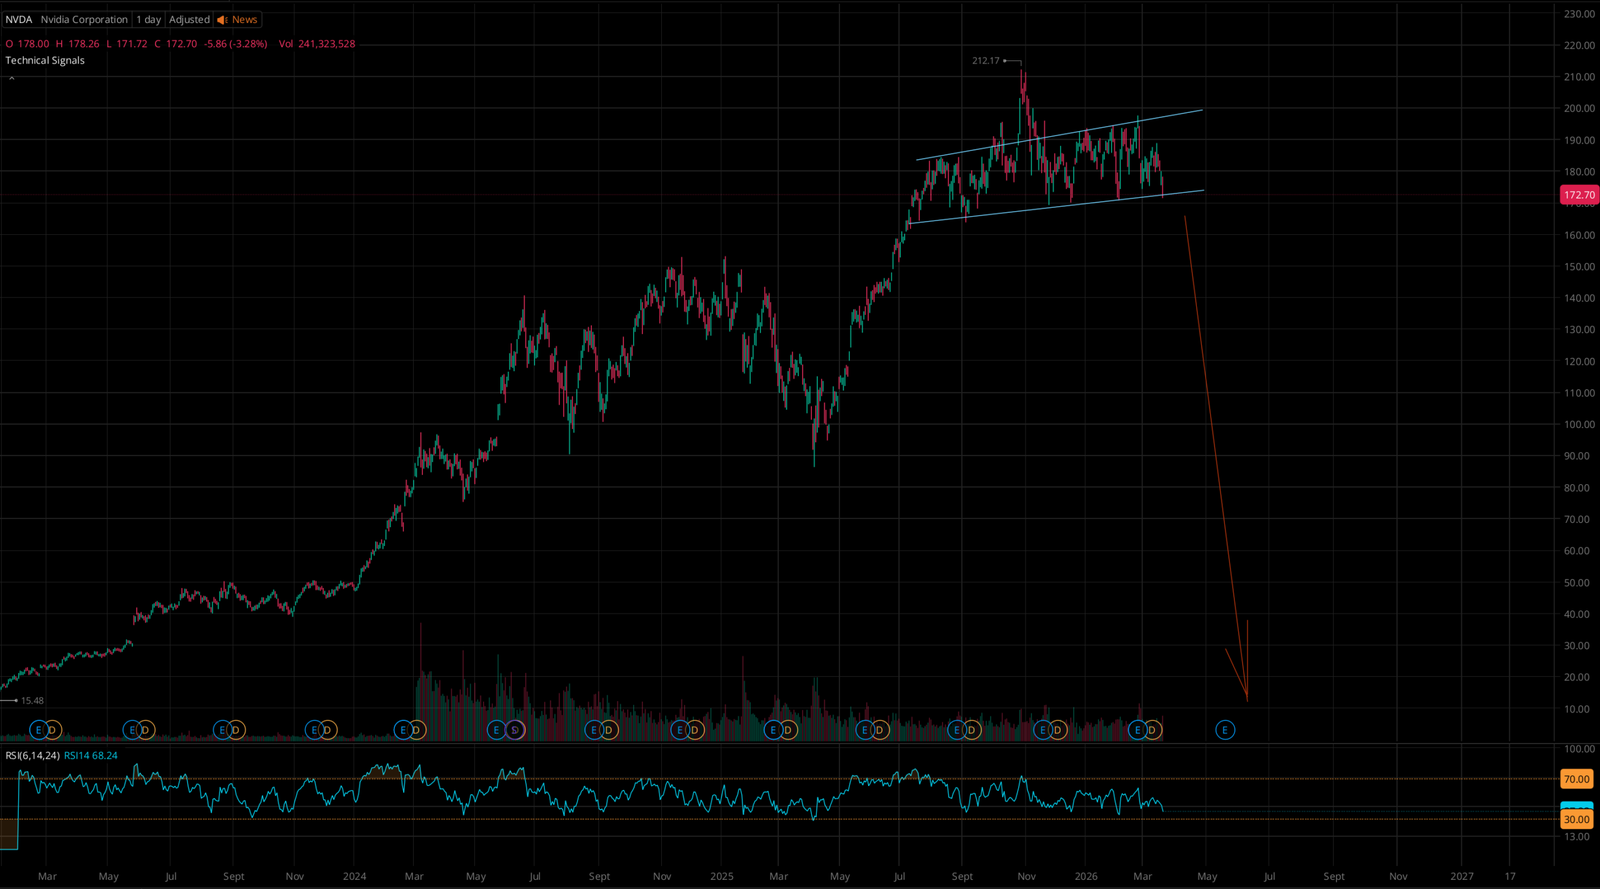
I have completely exited the United States Stock Market. I will re-enter only upon witnessing a correction of 35 to 50 percent from peak valuations. To those holding large retirement accounts, it is hereby counselled that you build a strong and defensible cash position without delay.

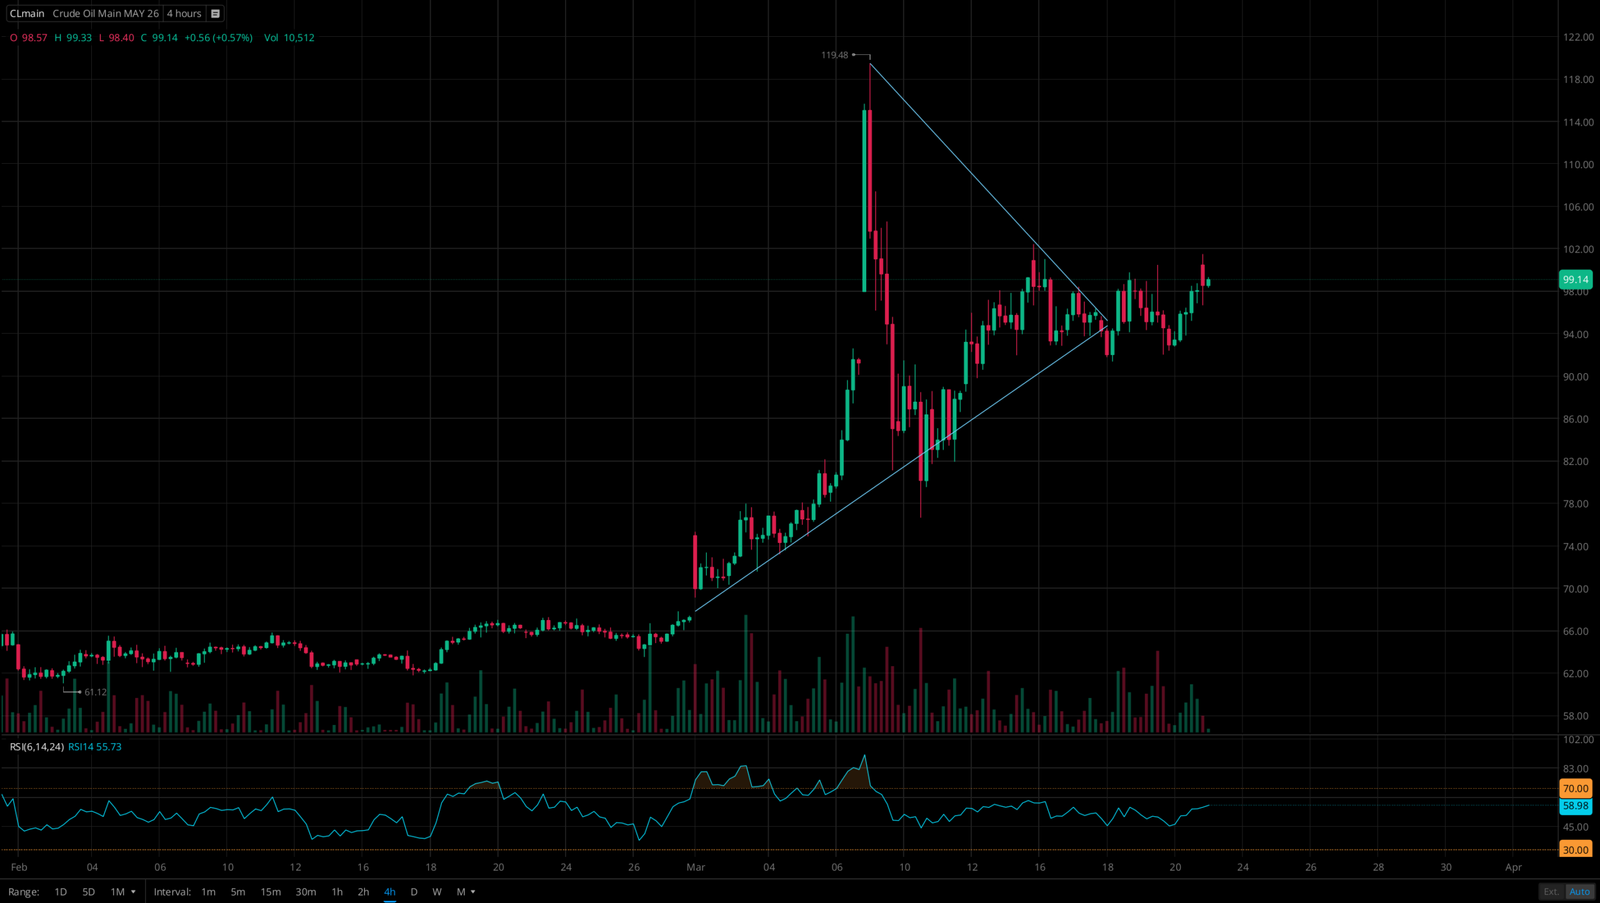
The confluence of forces presently arrayed against prosperity is without modern parallel. The Strait of Hormuz, through which twenty percent of the worlds oil once flowed with assured regularity, has been rendered effectively closed to non-Chinese tankers. What the mainstream financial press dismisses as a price spike is in truth a physical supply vacuum of historic proportions. Only ten percent of normal crude flows are presently making transit.

Simultaneously, the equity markets remain priced at the second highest valuations in 150 years of American financial history, surpassing even the heights preceding the Great Depression. The Shiller CAPE Ratio, standing at 39 to 41, is not a warning. It is a verdict. The Buffett Indicator, exceeding 200 percent of GDP, echoes the same proclamation.

I urge you to fact-check this research and make your own informed decision. The information set forth herein is offered freely and in good faith, for the protection of families and the preservation of hard-earned wealth.

The five forces driving this warning are as follows. First, the 2026 Middle East war has already disrupted 8 to 10 million barrels per day of oil supply, representing 8 to 10 percent of global supply. This surpasses every prior oil shock in recorded history, including the 1973 Arab Embargo, the 1979 Iranian Revolution, and the 1990 Gulf Crisis combined. Every major historical oil shock of this magnitude triggered a recession with equity declines reaching 40 percent.

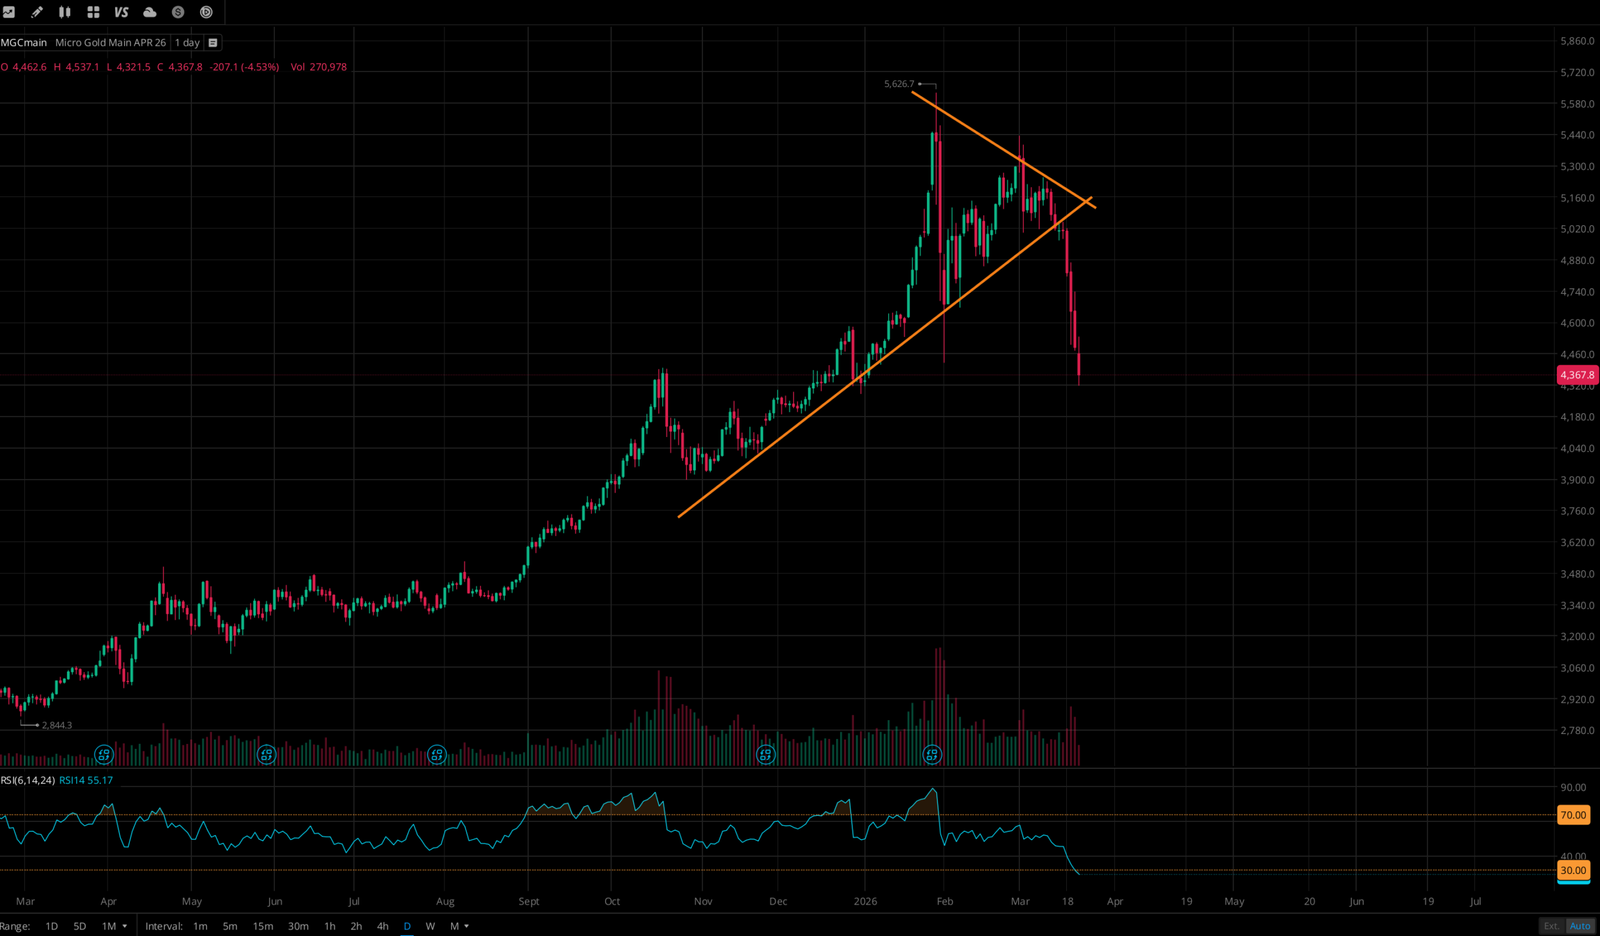
Second, gold is skyrocketing to all-time highs as investors flee to safe havens. The 2025 to 2026 move now completely overshadows every previous gold peak in modern history. This is not a cyclical rally. It is a flight to survival.

Third, the Buffett Indicator now stands above 200 percent of GDP. A healthy ratio sits at 1 to 1, where market cap equals GDP. We currently have a 69 trillion dollar market cap against a 30 trillion dollar GDP. A 50 to 55 percent market correction would be required simply to return to fair value.

Fourth, the Shiller CAPE ratio sits at 39 to 41 as of December 2025. A safe P/E historically falls between 15 and 20, with anything above 25 to 30 considered dangerously overvalued. We are presently at the second highest market peak in 150 years of American financial history, higher than the levels preceding the Great Depression and the 2008 housing crash.

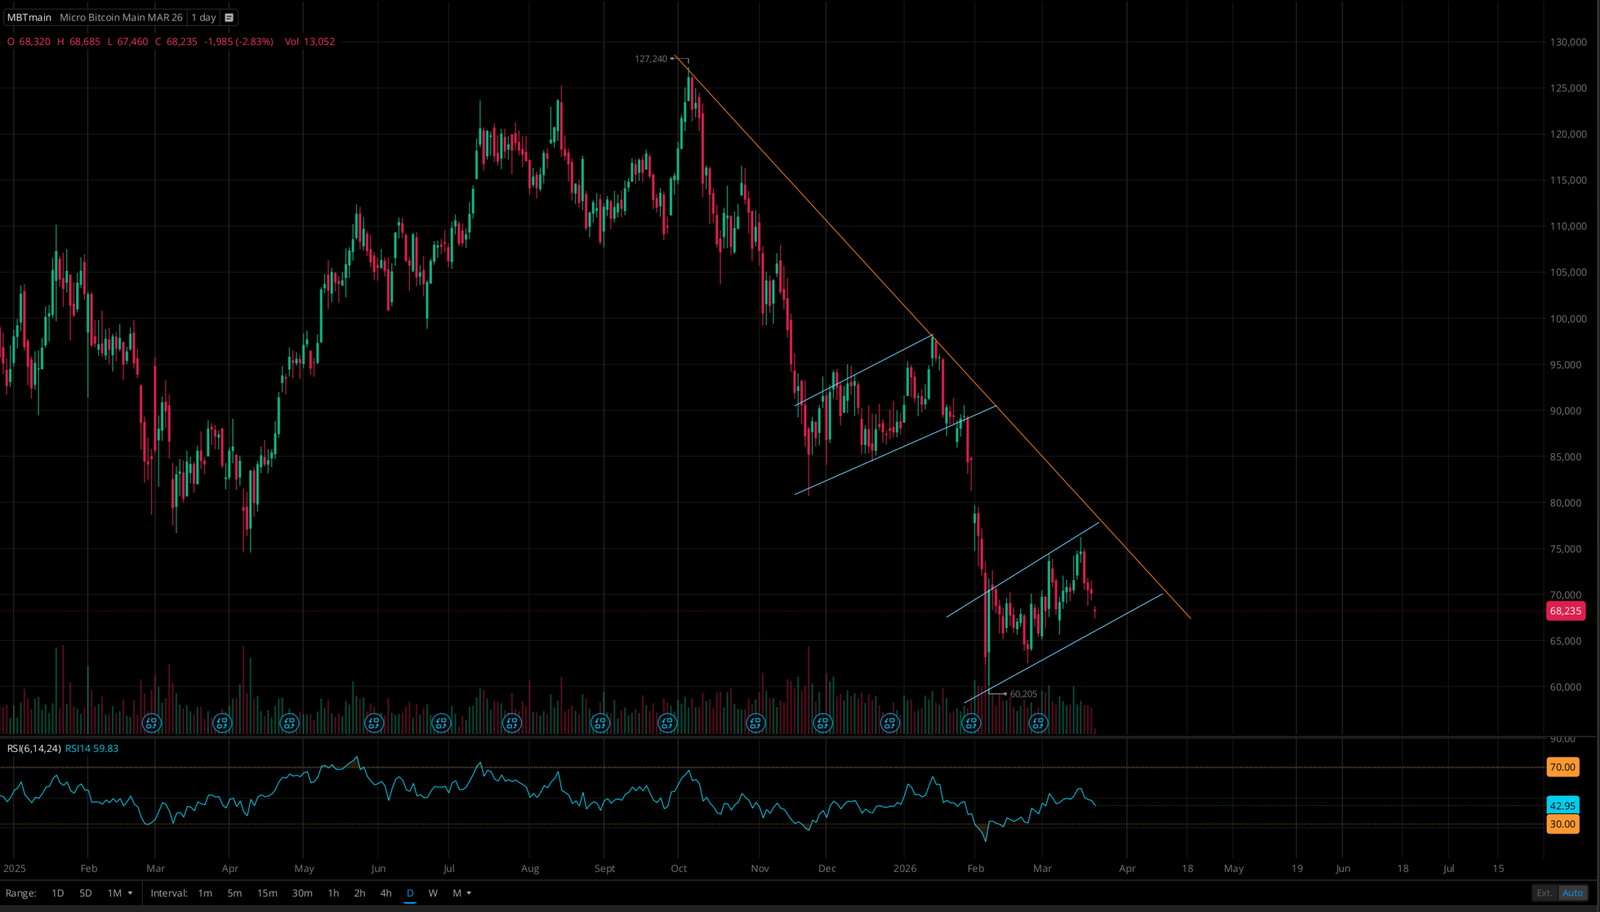
Fifth, the Dow to Gold ratio is now crossing the 15 threshold for only the fourth time in recorded history. A crashing Dow to Gold ratio has historically preceded every major crisis including the 1929 Great Depression, the 1973 recession, and the 2008 global financial crisis. Each of these five indicators points to the same conclusion.

Fact check my research and make your own informed decision. God Bless to all.
CONNOR STIFEL
THE LEVERAGED TRADER • VALUETECH STRATEGIES LLC • MARCH 16, 2026
⚠ This letter is for informational and educational purposes only. Nothing herein constitutes financial, investment, legal, or tax advice. All trading involves risk. Always conduct your own due diligence and consult a licensed financial advisor.
STIFEL TRADE DESK • ALLOCATION BREAKDOWN
PORTFOLIO SCENARIOS

PORTFOLIO ALLOCATION SCENARIOS

Each scenario represents a distinct macro environment. The ACTIVE scenario is what the Stifel Trade Desk is currently positioned in. Not financial advice.

🦢   CURRENTLY ACTIVE BLACK SWAN CRASH MODE
CURRENT MACRO POSITIONING • MARCH 16, 2026
MAX DEFENSE + SHORT
FULL COLLAPSE POSITIONING

The Stifel Trade Desk is operating at maximum defensive posture. VIX has exceeded 40, credit markets are seizing, banking stress indicators are flashing red and liquidity conditions resemble a Lehman-scale event. Zero equity exposure. Cash, gold and protective puts form the core of this positioning. This is not a drill.

ALLOCATION BREAKDOWN
💵 Cash / T-Bills
50%
🥇 Gold (GLD)
20%
📉 Puts
15%
🛢️ Energy
10%
🥈 Silver
5%
📈 US Equities
0%
PRIOR MODE WAR ECONOMY MAR 2026
War Economy Defense Oil Shock and Iran Conflict

Reference only. Geopolitical war, oil supply shock, Hormuz closed, stagflation risk.

💵 Cash / T-Bills
60%
🛢️ Energy (XLE)
15%
🥇 Gold (GLD)
10%
📊 Short Bonds
10%
📉 Puts (SPY/QQQ)
5%
📈 US Equities
0%
₿ Bitcoin
0%
STAGFLATION MOVES
Inflation and Stagnant Growth

High CPI and rising unemployment, Fed paralyzed, oil shock, negative real rates.

🥇 Gold (GLD)
30%
🛢️ Energy
20%
💵 Cash
20%
🥈 Silver
10%
🌾 Commodities
10%
📊 TIPS / Bonds
10%
SOFT LANDING / RECOVERY
Fed Cuts and Growth Re-Accelerates

Fed pivot confirmed, inflation cooling, earnings recovering, credit spreads tightening.

🇺🇸 US ETFs
25%
💵 Cash
20%
📊 Long Bonds
20%
🌍 Intl ETFs
15%
🥇 Gold
10%
₿ Bitcoin
5%
📞 Calls
5%
BULL RUN FULL RISK ON
Offense Mode: Equities, Growth and Leverage

Strong GDP, low unemployment, earnings beats, Fed neutral/cutting, VIX below 16.

🇺🇸 US ETFs
40%
📈 Stocks
20%
🌍 Intl ETFs
15%
₿ Bitcoin
10%
💵 Cash
5%
🥇 Gold
5%
📞 Calls
5%
📊 Bonds
0%
@TRADERLEVERAGED • LATEST POSTS
LIVE FEED

LIVE FEED @TraderLeveraged

𝕏
LATEST FROM @TraderLeveraged
FOLLOW ON X ↗
TLT
The Leveraged Trader
@TraderLeveraged • Mar 22

The U.S. economy is about to get nuked. This is not hyperbole. This is math. The Strait is closed. Oil is spiking. Rates are rising. Recession probability is now above 80%.

TLT
The Leveraged Trader
@TraderLeveraged • Mar 8

WTI crude surged 19% or more to approximately $108 to $117 per barrel amid the US-Israel war with Iran disrupting the Strait of Hormuz, attacks on oil facilities, and producer cuts.

📈 WTI CRUDE OIL $113.96   +27.67%   TRADINGVIEW
TLT
The Leveraged Trader
@TraderLeveraged • Mar 15

20% of the world's oil is currently hitting a brick wall. With the Strait of Hormuz effectively closed to non-Chinese tankers we are not just looking at a price spike. We are looking at a physical supply vacuum. Only 10% of normal crude flows are making it through.

STIFEL TRADE DESK • CHART ANALYSIS MARCH 2026
TECHNICAL ANALYSIS

📊 TECHNICAL ANALYSIS STIFEL TRADE DESK

CHART ANALYSIS AS OF MARCH 2026 • NOT FINANCIAL ADVICE • FOR EDUCATIONAL PURPOSES ONLY

🔴 BEARISH BREAKDOWN CONFIRMED
NVDA NVIDIA CORPORATION
WATERFALL SELL-OFF
NVDA Chart March 2026
NVDA LIVE CHART
PATTERN ANALYSIS

NVDA has broken decisively below its critical $177 support shelf, confirming a bull trap formation that followed its all-time high of $212.17. The stock is now consolidating within a descending wedge pattern. In a macro bear environment, this formation is historically a continuation signal to the downside and not a reversal.

The RSI reading of 68.24 remains elevated and has not yet reached oversold territory. This suggests considerable room to the downside before any meaningful capitulation occurs. When the market generals fall, the broader index follows. The Waterfall Sell-off thesis remains active and structurally intact.

In a full correction scenario, projected downside targets move through $120, then $80, and ultimately toward the $20 to $40 range representing a 50 to 80 percent decline from peak. This mirrors the pace and structure of the 2000 dot-com unwinding.

ATH
$212.17
BROKEN SHELF
$177
CRASH TARGET
$20 40
SIGNAL: BREAKDOWN BELOW $177 SHELF • RSI: 68.24 • PATTERN: DESCENDING WEDGE
🐻 BEARISH BEAR FLAG CONFIRMED
BTC MICRO BITCOIN FUTURES
BEAR FLAG
BTC Chart March 2026
BTC LIVE CHART
PATTERN ANALYSIS

Bitcoin printed an all-time high of $127,240 before entering a sustained downtrend defined by a sequence of descending bear flag formations. Each flag represents a brief consolidation pause before the next leg lower. This is a textbook continuation pattern signaling sustained distribution by large holders over time.

Price is presently trading near $68,235 having broken below the $80,000 to $75,000 support cluster. The RSI at 59.83 has not yet reached oversold territory which means further downside before a structural bottom forms remains the higher probability outcome.

The key support level to monitor is $60,205. A decisive break below that level would trigger a cascade toward $42,000 to $50,000. In a Black Swan macro environment, correlations across all risk assets converge sharply toward one.

ATH
$127,240
KEY SUPPORT
$60,205
BEAR TARGET
$42K $50K
SIGNAL: BEAR FLAG FORMED • RSI: 59.83 • PATTERN: DESCENDING CHANNEL
BULLISH BREAKOUT FROM DESCENDING WEDGE
WTI CRUDE OIL CL FUTURES
WEDGE BREAKOUT
WTI Crude Oil Wedge Breakout March 2026
WTI CRUDE OIL LIVE CHART
PATTERN ANALYSIS

WTI Crude Oil is breaking up from a descending wedge pattern, a classically bullish formation that signals the prior downtrend is exhausting. With the Strait of Hormuz disruption cutting normal crude flows to approximately ten percent of capacity, the fundamental backdrop fully supports this technical breakout. A confirmed close above the wedge resistance line opens the next leg higher in oil prices.

CAUTION BREAKDOWN FROM ASCENDING WEDGE
GOLD GLD / SPOT XAUUSD
WEDGE BREAKDOWN
Gold Descending Wedge Breakdown March 2026
GOLD LIVE CHART
PATTERN ANALYSIS

Gold is showing a potential breakdown from an ascending wedge, which is a bearish reversal pattern despite the prior uptrend. After an extraordinary parabolic run to all-time highs driven by safe-haven demand, the wedge formation suggests the upward momentum is narrowing and could be nearing exhaustion. A confirmed breakdown below wedge support would signal a near-term pullback in gold prices. This does not alter the long-term bullish macro thesis for precious metals in a crisis environment.

⚠ Technical analysis is for informational and educational purposes only. Past chart patterns do not guarantee future performance. Always conduct your own due diligence.

DEVELOPING SITUATION • MARCH 2026
LATEST NEWS

📰 LATEST NEWS UPDATES MARCH 2026

DEVELOPING SITUATION • SUPPLEMENTARY INTELLIGENCE SEPARATE FROM HERO ANNOUNCEMENTS ABOVE

WAR Mar 21 22, 2026
US Iran War Escalates With Direct Threats to Infrastructure

The United States and Iran exchange direct threats targeting energy and power infrastructure as fighting intensifies, with warnings of strikes on Iranian power plants and retaliation against US assets.

MISSILES Mar 20 22, 2026
Iran Launches Missile Attacks Across Region

Iran fires ballistic missiles at Israel and a US UK base while expanding its strike range toward Europe, prompting Israeli retaliatory strikes on Tehran and Hezbollah positions.

ENERGY CRISIS Mar 15 21, 2026
Strait of Hormuz Effectively Shut Down

Maritime traffic collapses after repeated attacks on tankers, disrupting roughly 20 percent of global oil supply and causing one of the largest energy shocks in modern history.

LNG STRIKE Mar 19, 2026
Iran Strikes Qatar LNG Facility

Missile strikes hit one of the world's largest natural gas export hubs, sharply escalating the conflict and sending global oil and gas prices surging.

MACRO Mar 18 22, 2026
Global Energy Crisis Deepens

Oil prices surge above recent highs as supply chains break down, with countries competing for limited energy and markets fearing prolonged inflation and shortages.

G7 Mar 18 21, 2026
G7 Emergency Response to Middle East War

Major economies coordinate emergency measures to stabilize energy markets and respond to the escalating Iran conflict and global economic fallout.

📈 ASSET WATCH LIVE CHARTS STIFEL TRADE DESK LIVE TRADINGVIEW CHARTS • CLICK TO EXPAND
// LIVE CHARTS POWERED BY TRADINGVIEW
GOLD XAUUSD
BITCOIN BITSTAMP
VIXY VIX SHORT-TERM FUTURES ETF
WTI CRUDE OIL USOIL
NVDA NVIDIA CORP
SILVER XAGUSD
DOLLAR STRENGTH AND GLOBAL FX FLOWS • LIVE TRADINGVIEW CHARTS
GLOBAL CURRENCY MONITOR
💱 GLOBAL CURRENCY MONITOR DOLLAR STRENGTH CRITICAL IN CRISIS ENVIRONMENT
// LIVE CURRENCY CHARTS POWERED BY TRADINGVIEW
UUP USD INDEX ETF (TRACKS DXY)
EUR/USD EURO
USD/JPY JAPANESE YEN
GBP/USD BRITISH POUND
USD/CAD CANADIAN DOLLAR
AUD/USD AUSTRALIAN DOLLAR
USD/CHF SWISS FRANC
USD/CNY CHINESE YUAN
USD/INR INDIAN RUPEE
STIFEL TRADE DESK • 150-YEAR HISTORICAL CHARTS • CLICK ANY CARD FOR SOURCE
DEEP MACRO INDICATORS
LIVE CHARTS • GOVERNMENT BONDS WORLDWIDE • 3-MONTH VIEW
GLOBAL TREASURY YIELDS
JOIN THE STIFEL TRADE DESK NEWSLETTER
INTEL NETWORK
📡
JOIN THE INTEL NETWORK
STIFEL TRADE DESK • REAL-TIME MARKET INTELLIGENCE
LIVE UPDATES WHEN MARKETS MOVE
THE LEVERAGED TRADER • STIFEL TRADE DESK • VALUETECH STRATEGIES LLC
REAL-TIME MARKET INTELLIGENCE • EST. 2026
⚠ DISCLAIMER: The Leveraged Trader / ValueTech Strategies LLC is for informational and educational purposes only. Nothing on this website constitutes financial, investment, legal, or tax advice. All trading involves risk. Past performance is not indicative of future results. Always conduct your own due diligence and consult a licensed financial advisor before making any investment decisions.
© 2026 VALUETECH STRATEGIES LLC
ALL RIGHTS RESERVED